RCCN WeChat QrCode
 Mobile WebSite
The Organization for Economic Co-operation and Development (OECD) is an intergovernmental international economic organization of 35 market economy countries designed to jointly address the challenges of economic, social and government governance brought about by globalization and Grasp the opportunities brought about by globalization.
Recently, the International Energy Agency (IEA) released the OECD 2016 power generation situation statistics report. International Electricity observation of the contents of the report were refined and combed in the current push to share with you.
In 2016, the OECD's overall electricity generation increased slightly, but the amount of electricity generated by member countries changed in varying degrees.
01 Total power generation
According to the 2016 monthly data, OECD's 2016 net power generation increased by 0.9% compared to 2015. In this small total change, geothermal, solar, wind and other renewable energy sources increased significantly by 9.5%, while hydropower capacity increased by 2.2%, fuel and nuclear power generation also increased by 0.2% and 0.1 %.
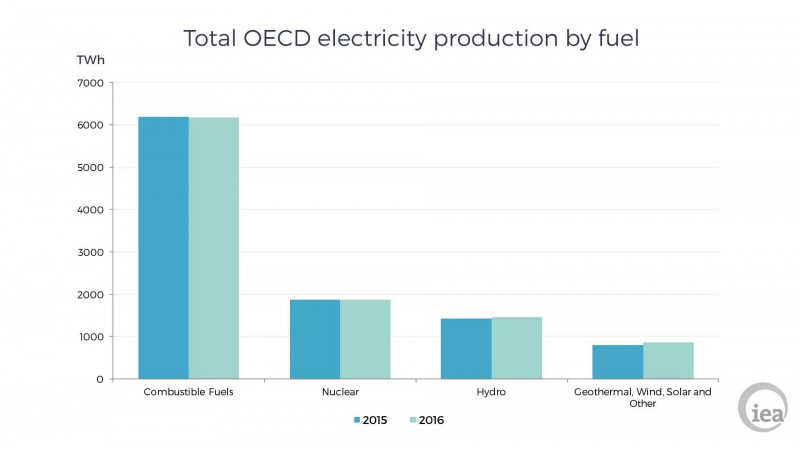
Figure 1. OECD comparison of total generating capacity for 2015 and 2016
In the OECD's 2016 generating capacity, non-combustible renewable energy production accounted for 22.4%, compared with 21.6% in 2015, an increase of 0.8%. In addition, fuel power generation accounted for 59.5%, while in 2015 its accounting for 60.2%, a decrease of 0.7%. There is almost no change in nuclear power generation compared to 2015.
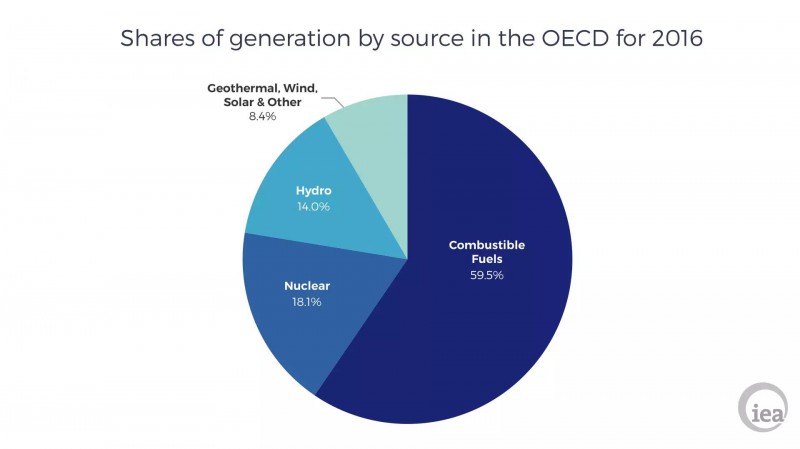
Figure 2. 2016 OECD overall proportion of all types of energy generation
Compared with 2015, OECD's overall electricity generation increased by 0.9% in 2016, but the share of fuel power generation in the OECD regions in 2016 has changed differently.
In the OECD region of the Americas, fuel generation was reduced by 0.7%, nuclear power generation increased by 1.5%, hydropower generation increased by 3.2%, while geothermal, wind, solar and other renewable energy increased significantly by 22.5%.
The OECD Asia-Oceania region also shows the same trend. Fuel power generation fell by 0.5%, but nuclear power generation increased by 6.6%, hydropower generation increased by 1.4%, geothermal, wind, solar and other renewable energy power generation growth the most obvious, reaching 12.6%.
OECD Europe shows a different trend, the largest increase from fuel power generation, an increase of 2.6%, hydropower generation increased by 1.0%. Other non-combustible renewable energy generating capacity remained almost unchanged, while the only reduction was nuclear power generation, a decrease of 2.4%.

Figure 3. Percentage of energy generation in the OECD regions
As can be seen from the above chart, non-flammable renewable energy accounts for 30% in Europe, 21% in the Americas and 12% in Asia and Oceania. Fuel is still the main source of electricity for each region, accounting for 61% of the Americas, 78% in Asia and Oceania, and 47% in Europe. Nuclear power generation accounts for 23% in Europe, 18% in the Americas and 9.5% in Asia and Oceania.
Electric power generation
OECD's cumulative fuel generation in 2016 was 6174.3 TWh, which was 0.2% lower than the 2015 generating capacity. From the regional perspective, Asia - Oceania, the Americas were 0.5% lower, 1.5%. But in Europe increased by 2.6%.
In the fuel consumption, natural gas gradually replaced the coal. The trend has continued in the United States and the UK for many years. In 2016, due to the low price of natural gas, the United States reduced the use of coal-fired power plants, instead of natural gas power plants. In the UK this change is mainly affected by the rise in British coal prices.

Figure 4. US and British natural gas, coal and other energy generation
Nuclear power generation
OECD 2016 cumulative nuclear power generation capacity of 1873.6TWh, compared with 2015 reduced 2.7TWh. Europe is the only region where nuclear power generation is reduced. Mainly because Germany, France and other countries began to gradually eliminate backward nuclear power units.

Figure 5. Annual nuclear power generation in Europe
Hydroelectric power generation
2016 OECD hydropower total generating capacity 1451.6TWh, than in 2015 increased by 30.7TWh. There has been growth in every region of the OECD. From 2000 to 2015, hydropower generation increased by only 0.8%, mainly because most of the OECD's hydropower development potential has been developed. The increase in hydropower capacity in 2016 was mainly due to increased rainfall in many countries, particularly in Canada, the United States and Norway (the top three hydroelectric countries in the OECD).
Renewable Energy Power Generation
OECD's total electricity generation for geothermal, solar, wind and other renewable energy in 2016 was 873.9 TWh, an increase of 75.6 TWh compared to 2015. Among them, Europe increased by 1.9TWh, Asia - Oceania region increased by 9.6TWh, the Americas grew the most, 64.1TWh.
Cross - border electricity trading
OECD's cross-border electricity transactions are represented primarily in Europe and the Americas, as there is no cross-border electricity transaction between OECD Asia-Oceania member countries. In the United States, total imports and exports in 2016 increased by 8%. In Europe, imports increased by 8.7% in 2016 and export power by 9.8%. Between 2015 and 2016, some countries have moved from net importers to net exporters, such as Portugal and Ireland, and some have changed from net exporters to net importers such as Spain, Switzerland and Poland. France is still a net exporter, but as a result of the reduction in nuclear facilities, the export capacity has been drastically reduced.

Figure 6. Europe 2015 and 2016 electricity transactions